Franchise market intelligence.
Dale Library turns thousands of FDDs into structured data. Filter by fee, state, or outlet count. Every value links to the page it came from.
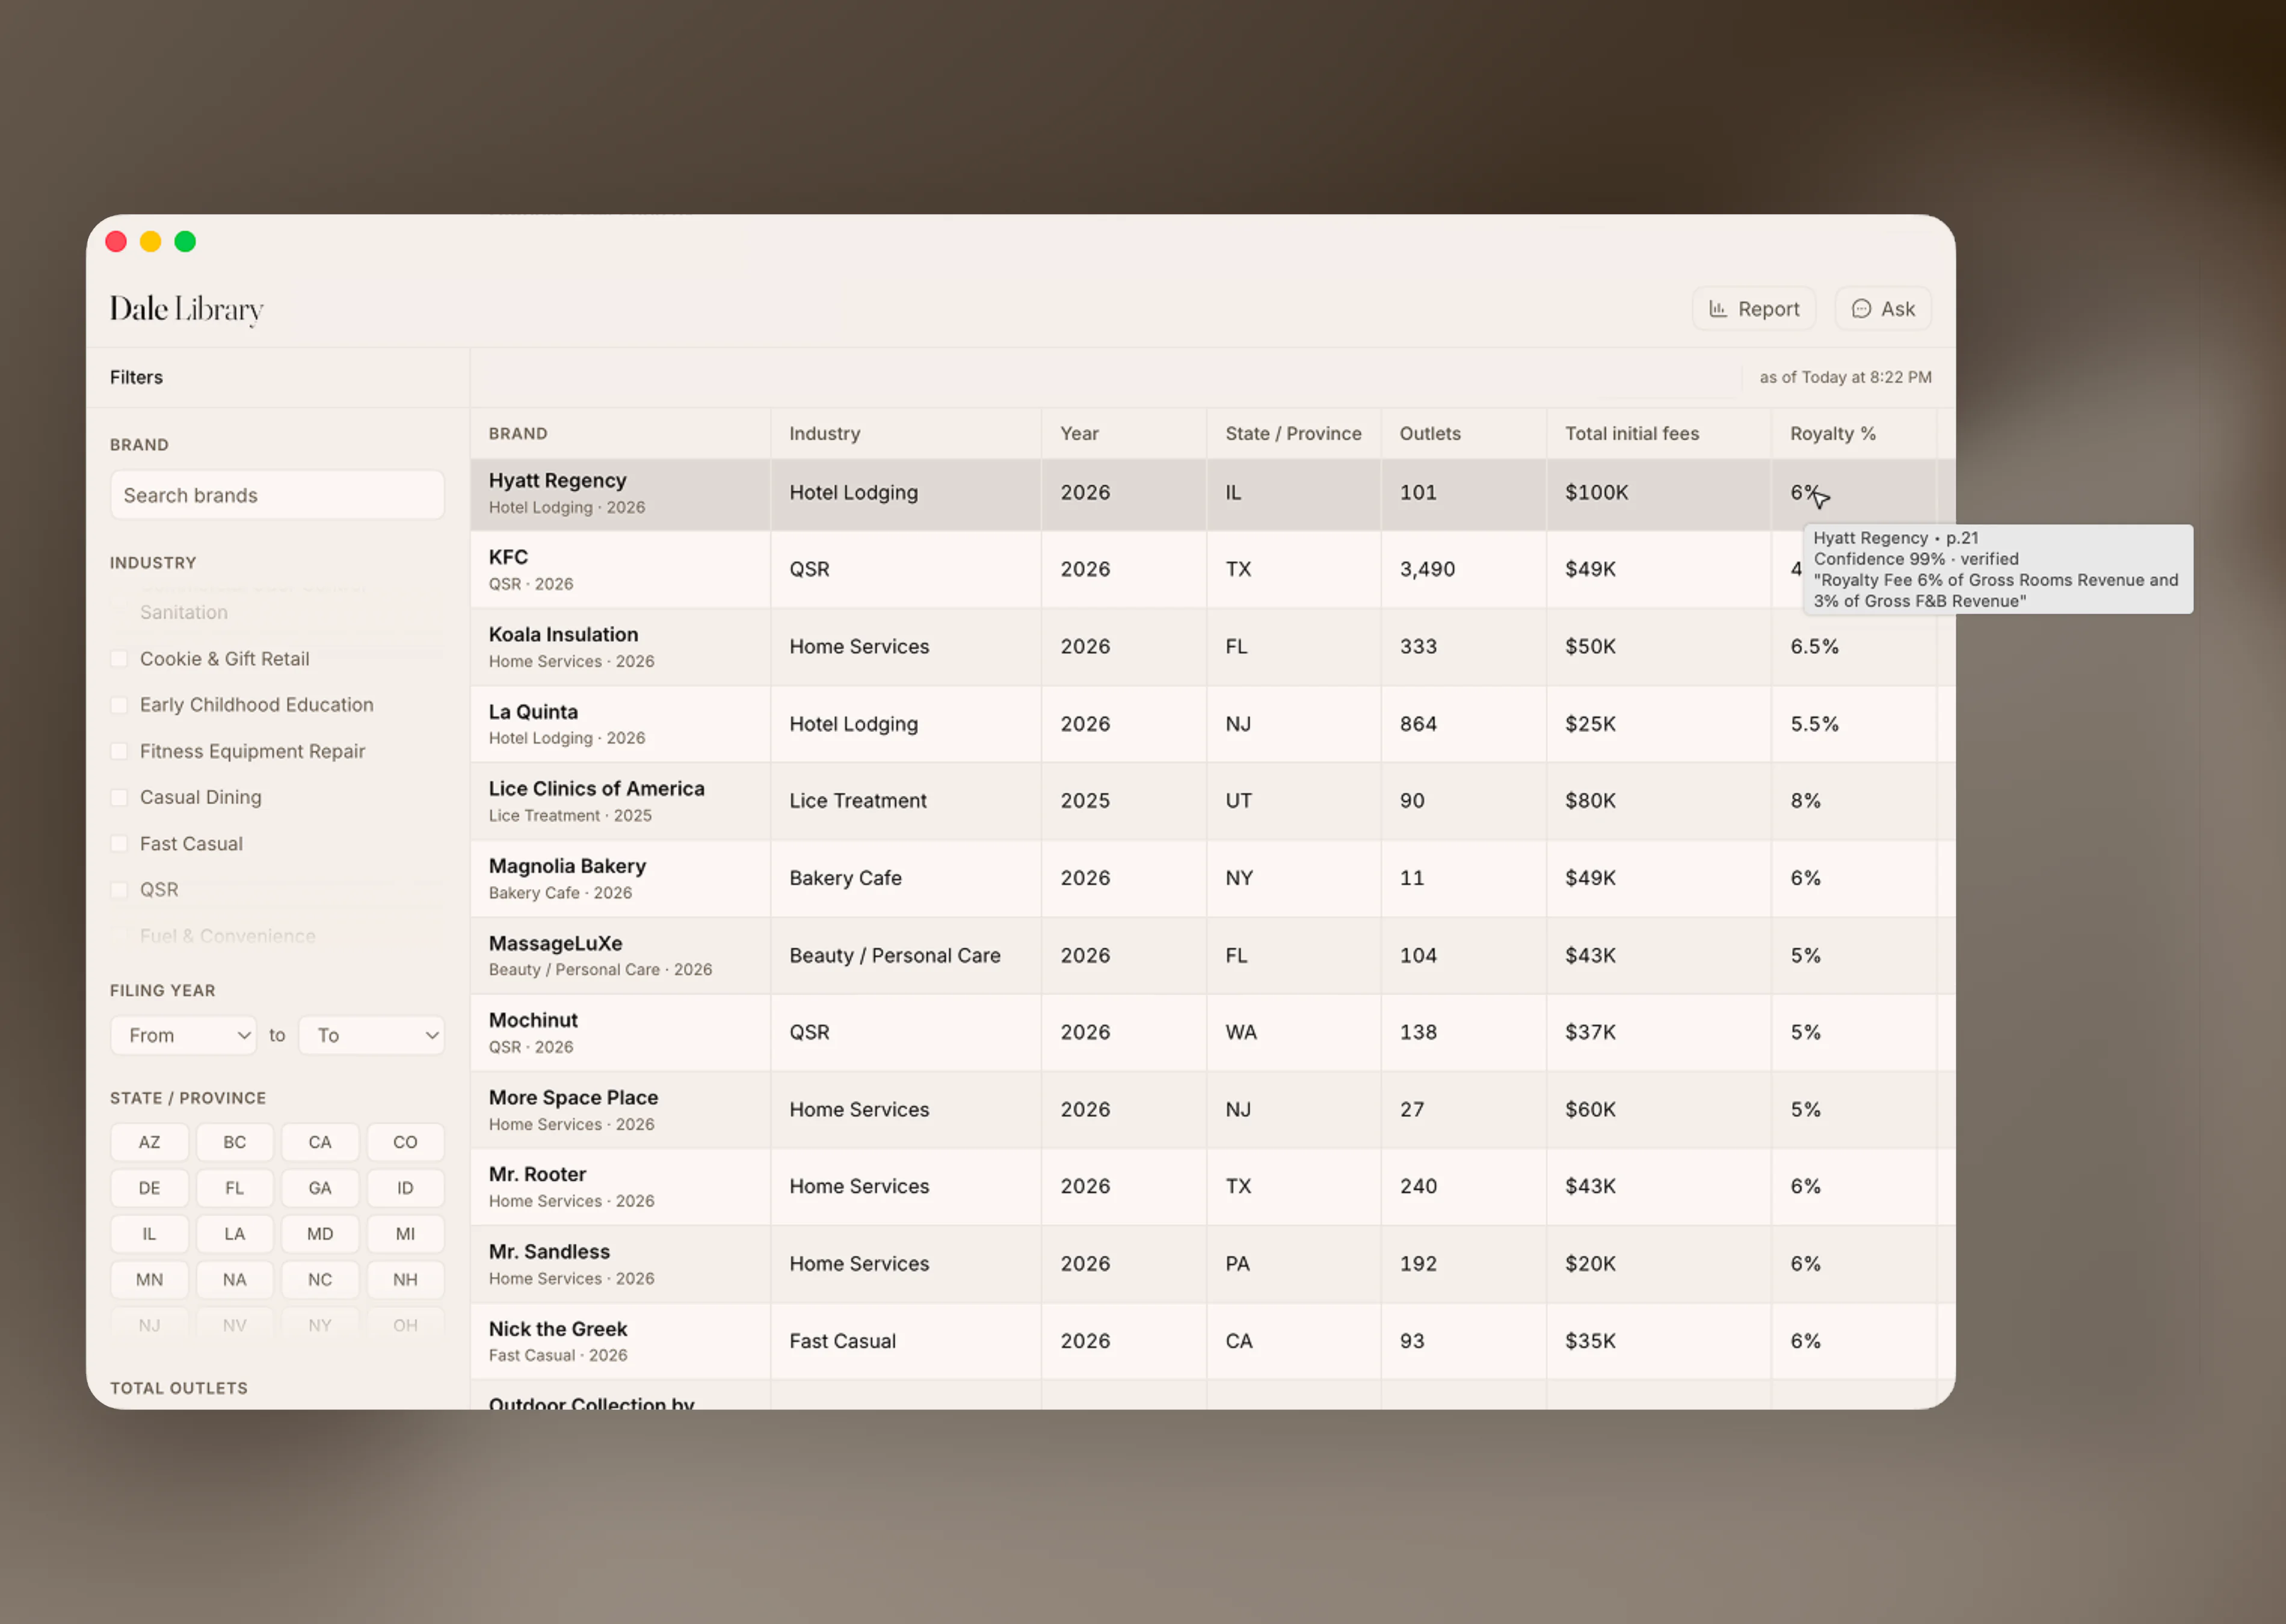
The numbers behind every brand.
Screen the market, benchmark a brand, or pull the fields your team tracks.
Filter and compare in seconds
Narrow thousands of brands by state, filing year, fee, or any extracted field. Sort, group, and compare without opening a single PDF.
Save a question, run it again
Turn a recurring analysis into a saved report. Come back next quarter and read the same table against a current cohort.
Define the fields you need
Pull the data points your team works with, validated and cited. Publish to a share link or export to Excel.
When filters are not enough, ask.
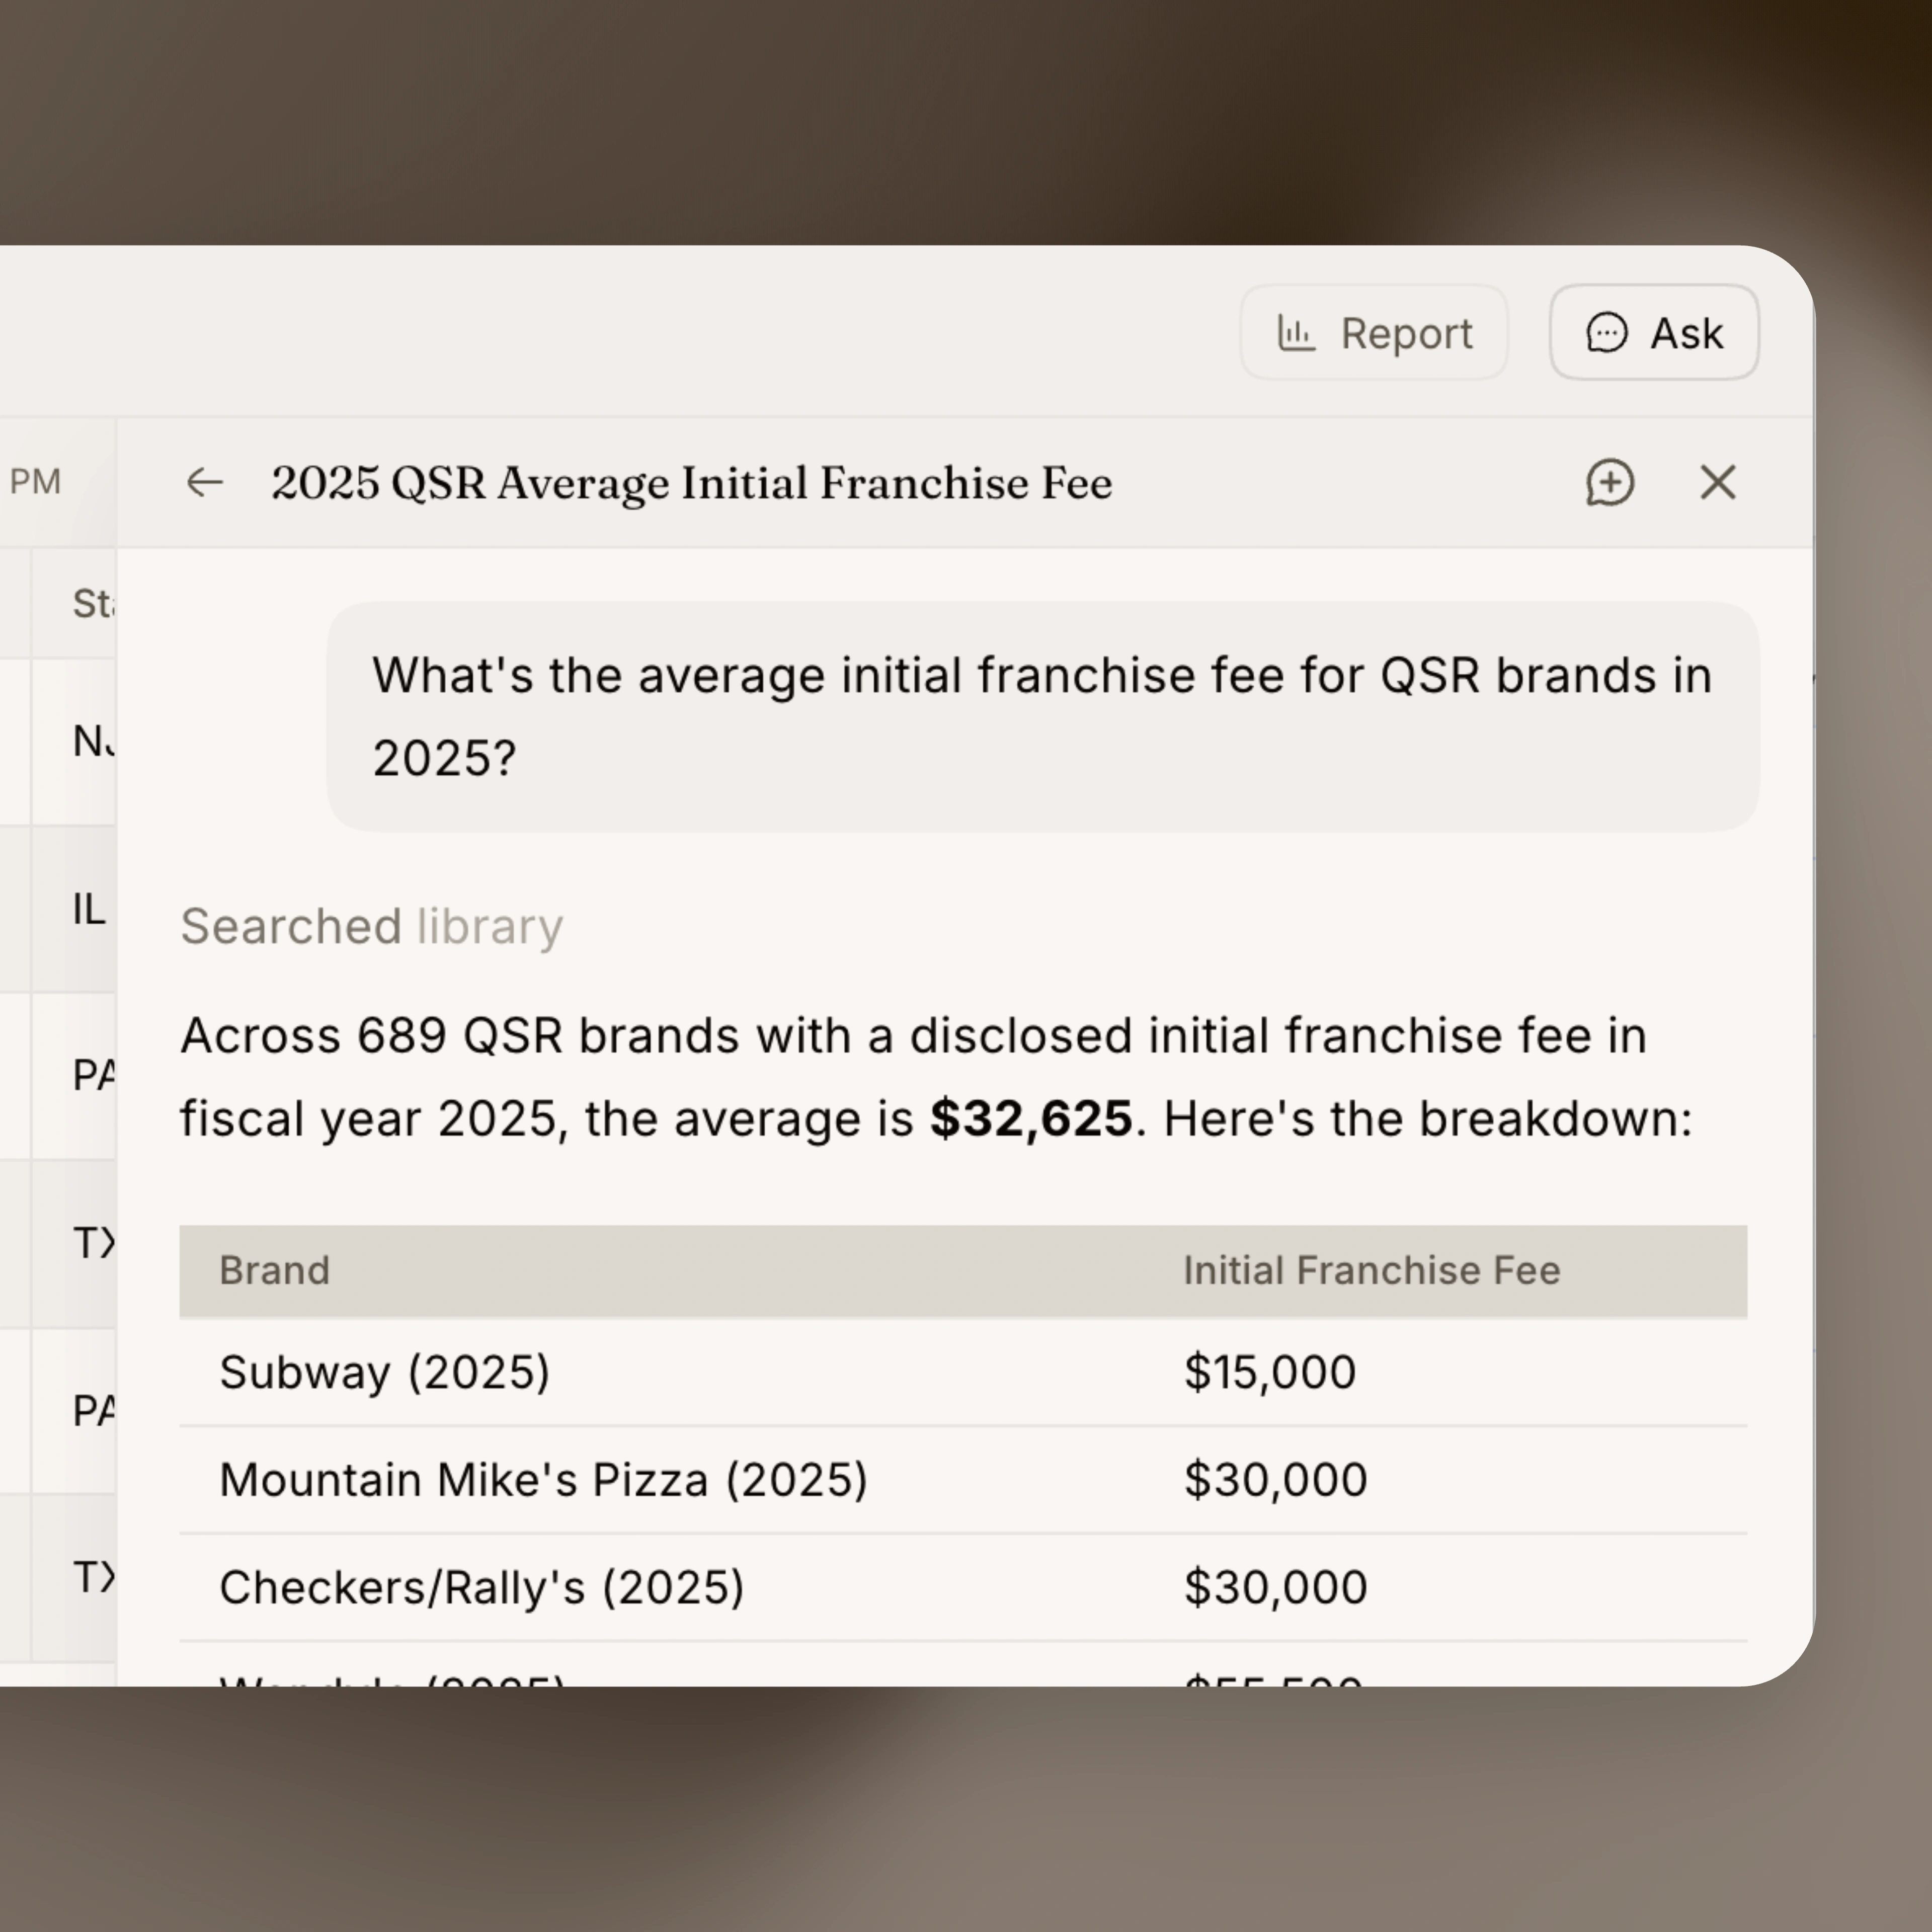
Ask the question the way you would say it. Dale runs it across every brand in view and returns the answer, with the brand-level numbers behind it.
Every figure traces back to the filing it came from.
FAQs
What is Dale Library?
A spreadsheet-style table of the key numbers from thousands of FDDs, such as initial fees, royalty rates, investment ranges, and unit counts, by brand and filing year. Filter it, sort it, and download it to Excel. Every number links to the FDD page it came from.
What information is in the table?
Initial fees, royalties, investment ranges, the number of franchised and company-owned units, and the states each brand is registered in, across thousands of brands and several filing years. If your team tracks a figure that is not there, Dale can pull it from every filing for you.
What can I do with it?
Narrow the list to the brands you care about, for example restaurant brands registered in California, then sort by royalty or fee to see where a brand falls against its competitors. Download the result to Excel or send a link to a colleague.
Can I ask a question instead of filtering?
Yes. Ask something like "What is the average initial fee for restaurant brands in 2025?" Dale calculates it across every matching brand and shows the brand-by-brand numbers behind the answer.
Can I save a comparison and run it again later?
Yes. Save a comparison, such as the initial fee for every restaurant brand, and run it again next quarter to get the same table updated with the newest filings.
Who is Dale Library for?
Private equity and investment teams comparing franchise systems, franchisors checking how their fees compare to competitors, franchise attorneys advising clients on what terms are typical, and industry researchers. Library is sold to organizations, not to individual franchise buyers.
Do I need Dale Review to use Library?
No. Library is available on its own.